Apache DataSketches: A Guide to Sketch Types
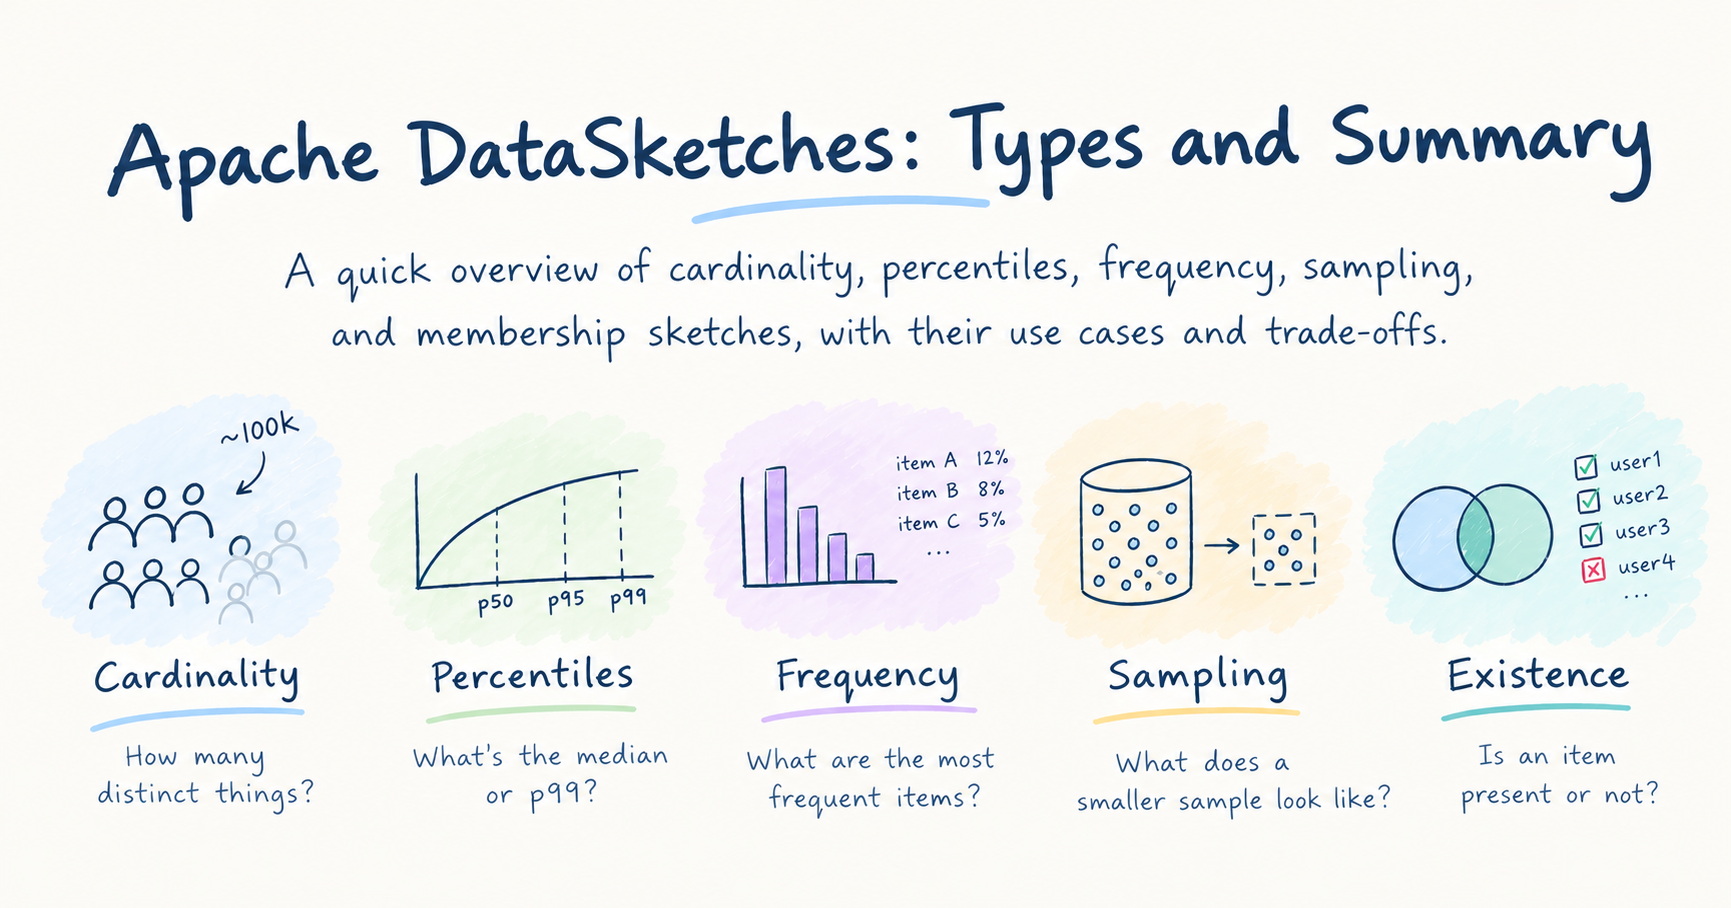
A quick overview of cardinality, percentiles, frequency, sampling, and membership sketches, with their use cases and trade-offs.
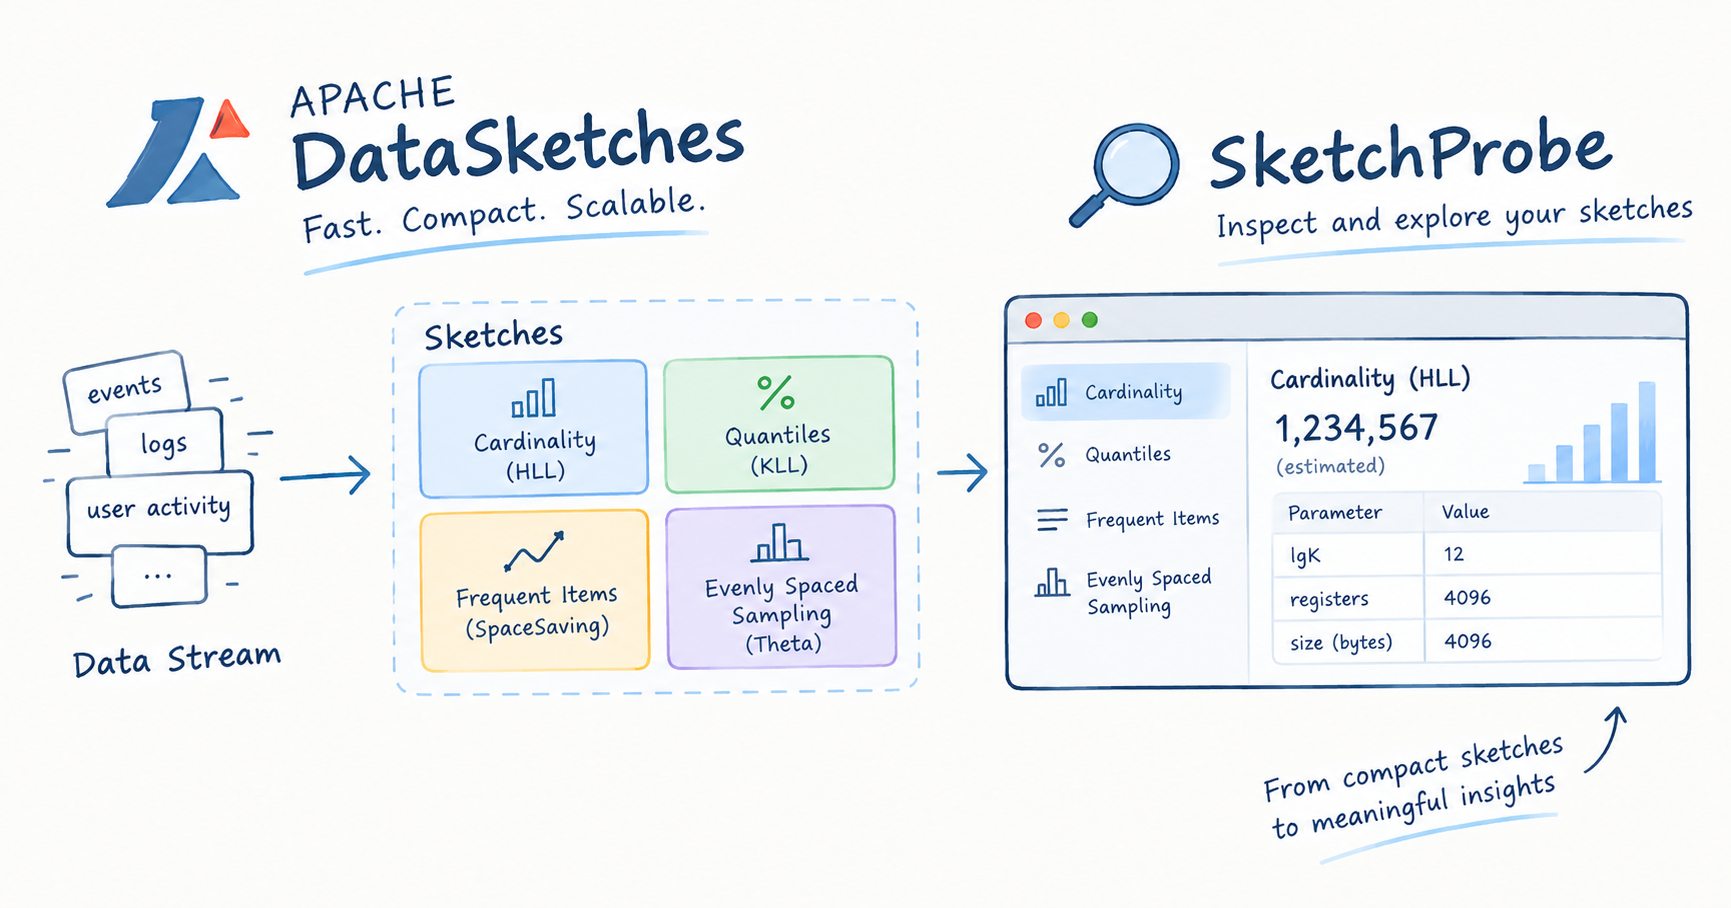
In the previous article, we discussed about how to use Apache DataSketch in Scala and looked at the sketchprobe tool to view the contents of a sketch in readable format.
This article gives a summary and overview of different sketch types. Consider this as a datasketch cheatsheet to get an overview.
There are over 20 types of sketches across 5 families. The sketches in the same family solves more of less the same problems. In other words, the sketches in a family answers one type of question.
1. Cardinality: How many distinct things?
This family gives the estimates about the cardinality or distinct counts of values/keys.
| Sketch | Idea | Special ability | Trade-off |
|---|---|---|---|
| HLL | Keeps small registers that record how rare the hashes it has seen are. | Smallest and fastest. Can be merged (union). | Counts only. No direct intersection or difference, and it cannot list items. |
| Theta | Keeps the k smallest hash values it has seen. | Set operations: union, intersection, and difference (A − B). | Uses more memory than HLL for the same accuracy. |
| CPC | Does the same job as HLL, but uses a compressed representation. | Better accuracy per byte than HLL (about 40% smaller in some configurations). | Slower, and the internal representation is more complex. |
| Tuple | Theta-like sketch with an associated summary value attached to each retained key. | Tracks distinct items along with associated data, such as total spend per user. | The value type is not stored in the serialized sketch; the application must know how to interpret it. |
How to choose? If you only need a count, use HLL (or CPC for more compactness). If you need to ask "how many users are in both A and B", use Theta. If each user also carries a number, use Tuple.
Example use cases:
- Website analytics - Estimate the number of unique visitors per day.
- Infrastructure monitoring: Estimate the number of unique IP addresses seen across billions of log records.
2. Percentiles: What's the median or p99?
This family estimates percentiles of a stream of numbers, helping you understand the distribution of your data.
| Sketch | Error guarantee | Item types | Notes |
|---|---|---|---|
| Quantiles (classic) | Uniform rank error across the distribution | double |
Older design. The parameter k must be a power of two. |
| KLL | Uniform rank error across the distribution | float, double, long, strings (depending on implementation) |
More space-efficient than the classic quantiles sketch for comparable accuracy. k does not need to be a power of two. |
| REQ | Relative rank accuracy focused on either the high or low tail | float |
Useful for tail-focused queries, such as p99.9. You choose which end to prioritize. |
| t-Digest | No strict, general-purpose rank-error guarantee | double |
A separate sketch design. Often compact and effective at estimating extreme quantiles, but its accuracy is empirical rather than guaranteed. |
In short: KLL replaces Quantiles for new code, REQ is for extreme tails, and TDigest is a pragmatic alternative with no formal bound.
Example use case:
- API latency analysis: Understand response-time distributions, such as p50 (median), p95, and p99 latency.
- E-commerce analytics: Calculate the median purchase value during a campaign to understand typical customer spending.
3. Frequency: What are the most frequent items?
This family identifies items that occur frequently in a data stream and estimates their frequencies without storing every occurrence.
| Sketch | Keeps the keys? | Answers |
|---|---|---|
| Frequency (Frequent Items) | Yes: it stores the heavy hitters themselves. | "What are the top 20 platforms?" with an error bound. |
| Count-Min | No: it stores only a grid of counters. | "How many times did key X appear?" for any queried key. It never underestimates the frequency. |
Frequency tells you what is popular(heavy hitters). CountMin can only tell you how often a key you already know appeared.
Example use case:
- Browser analytics: Estimate how many requests came from a each browsers
- Log analysis: Estimate the frequency of a specific error code across millions of log entries.
4. Sampling: Give me a sample of the data
This family maintains a representative sample of a large data stream without storing every record.
| Sketch | What it does |
|---|---|
| Reservoir | Maintains a fixed-size, uniformly random sample of items. |
| VarOpt | Maintains a sample of weighted items, optimized so that sums over subsets (e.g., "revenue for customers in Germany") can be estimated accurately. |
| EBPPS | Maintains a weighted sample with exact inclusion probabilities for each item. |
Unlike the other groups, these hold real items, so the original data is visible.
Example use case:
- E-commerce: Study a sample of purchase transactions to understand customer buying behavior
- Customer analytics: Analyze a sample of customers to understand demographics, spending patterns, or purchasing habits.
5. Existence: Have I seen this value before?
This family checks whether a value has been seen before or belongs to a set, helping detect duplicates efficiently without storing every item.
| Sketch | Idea | Special ability | Trade-off |
|---|---|---|---|
| Bloom Filter | Uses a bit array and multiple hash functions to represent a set. | Checks whether an item may have been seen before, with a configurable false-positive rate. | Can report false positives, but standard Bloom filters have no false negatives for inserted items. Cannot list stored items. |
| Xor Filter | Stores a compact fingerprint for each item using an XOR-based structure. | Efficient membership checks with a low false-positive rate and compact storage. | Typically built for a fixed set of items; adding new items generally requires rebuilding the filter. |
Bloom and Xor filters answer yes or no for one value. They don't count or estimate anything.
Example use case:
- Database optimization: Check whether a value might exist before performing an expensive database lookup.
- Network security: Quickly check whether an IP address belongs to a known blocklist using a compact filter.
What kind of data is stored in the blob?
| Group | What the blob stores |
|---|---|
| HLL, CPC | Compact summaries used to estimate distinct counts. Some small HLL sketches may store hashed values in list or set mode. Original values cannot be recovered. |
| Theta | Hashes of retained distinct values, not the original values themselves. |
| Tuple | Hashes of retained keys, plus associated summary values for each retained key. |
| KLL, Quantiles, REQ | A sample of the original numerical values, plus compact summary information used to estimate quantiles. Not the entire dataset. |
| Frequency (Frequent Items) | Candidate item keys and frequency-related counters or estimates. Items are encoded using a serializer (serde). |
| Reservoir | The actual sampled items, encoded using a serializer (serde). |
| VarOpt | The actual sampled items, their weights, and sampling-related information, encoded using a serializer (serde). |
| Bloom Filter | A bit array representing set membership. Original values cannot be recovered. |
| XOR Filter | A compact fingerprint-based structure for set membership. Original values cannot be recovered. |
| Count-Min Sketch | A grid of counters used to estimate item frequencies. Original item identities cannot be recovered from the sketch alone. |
About the author
Travel | Movies | History | Nature
I am a software developer. Started my career as a Java developer, but later switched to Scala. I wish to write Scala articles which are easier for newbies to follow. I love to travel, prefer to be alone or in very small group. Love to watch movies/series.
Comments
Join the discussionNo comments yet. Be the first to comment.